统计图表实现(二)
1546
0
2022-01-24
2022-10-13
Hey、小怪兽
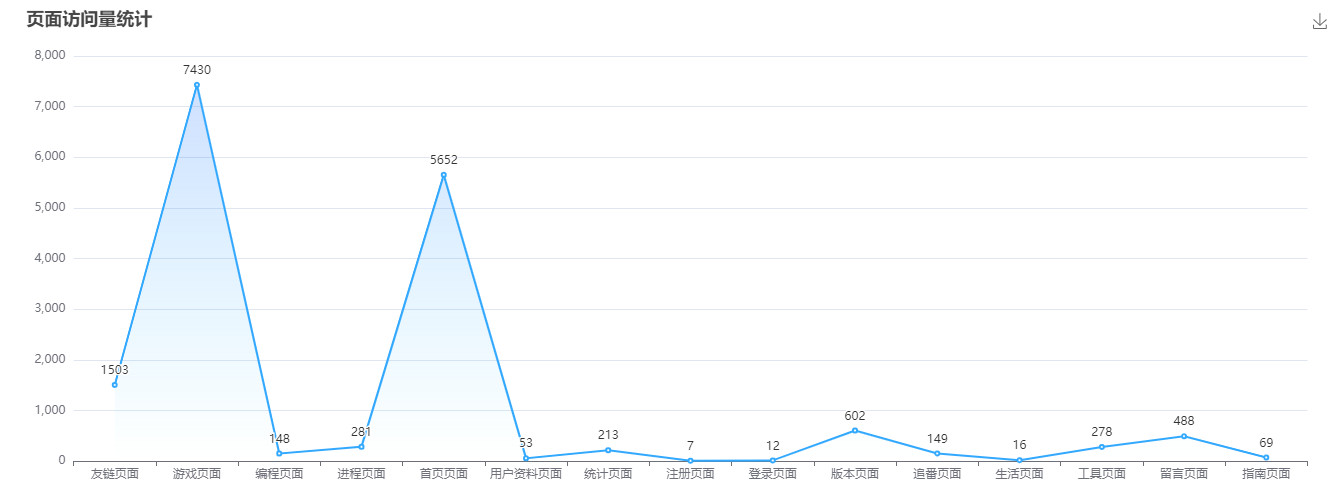
页面访问量统计
-
let myChart_viewBlock = echarts.init(document.getElementById('ta-static-viewBlock'));

myChart_viewBlock.setOption({
    title: {
        top: '2%',
        left: '1%',
        text: '页面访问量统计'
    },
    toolbox: {
        top: '2%',
        feature: {
            saveAsImage: {
                title: '保存'
            }
        },
        iconStyle: {
            emphasis: {
                borderColor: '#393939',
            },
        },
    },
    tooltip: {
        trigger: 'axis',
        axisPointer: {
            type: 'cross',
            crossStyle: {
              color: '#999'
            }
        }
    },
    grid: {
        left: '2%',
        right: '2%',
        bottom: '3%',
        containLabel: true
    },
    xAxis: [{
        type: 'category',
        data: ['工具页面', '指南页面', '友链页面', '首页页面', '留言页面', '生活页面', '进程页面', '注册页面', '社规页面', '版本页面', '编程页面', '登录页面', '图床页面', '审核页面', '追番页面'],
        axisLabel: {
            show: true,
            interval: 0
        }
    }],
    yAxis: [{
        type: 'value'
    }],
    series: [{
        name: '访问量',
        type: 'line',
        showSymbol: true,
        label: {
          show: true
        },
        itemStyle: {
            normal: {
                color:'#32A8FF',
                lineStyle: {
                    color:'#32A8FF'
                },
                areaStyle: {
                    type: 'default',
                    color: new echarts.graphic.LinearGradient(0, 0, 0, 1, [
                        {offset: 0, color: 'rgba(80,141,255,0.39)'},
                        {offset: .34, color: 'rgba(56,155,255,0.25)'},
                        {offset: 1, color: 'rgba(38,197,254,0)'}
                    ]),
                },
            },
        },
        data: [275, 68, 1502, 5622, 487, 15, 275, 6, 113, 590, 110, 10, 110, 72, 151]
    }]
});

// 使用刚指定的配置项和数据显示图表。
window.onresize = function () {
    myChart_viewBlock.resize();
}
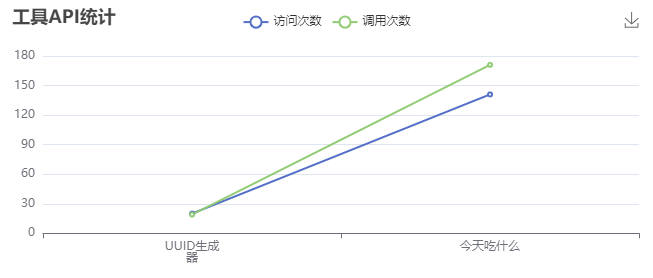
工具API统计
-
let myChart_toolAPIBlock = echarts.init(document.getElementById('ta-static-toolAPIBlock'));

myChart_toolAPIBlock.setOption({
    title: {
        top: '3%',
        left: '2%',
        text: '工具API统计'
    },
    tooltip: {
        trigger: 'axis'
    },
    legend: {
        show: true,
        top: '5%',
        left: 'center',
        data: ['访问次数', '调用次数']
    },
    grid: {
        left: '3%',
        right: '3%',
        bottom: '3%',
        containLabel: true
    },
    toolbox: {
        top: '3%',
        right: '2%',
        feature: {
            saveAsImage: {
              title: '保存'
            }
        },
        iconStyle: {
            emphasis: {
                borderColor: '#393939',
            },
        },
    },
    xAxis: {
        type: 'category',
        data: ['UUID生成器', '今天吃什么'],
        axisLabel: {
            show: true,
            interval: 0
        }
    },
    yAxis: {
        type: 'value'
    },
    series: [{
        name: '访问次数',
        type: 'line',
        data: [20, 141]
    }, {
        name: '调用次数',
        type: 'line',
        data: [19, 171]
    }]
});

// 使用刚指定的配置项和数据显示图表。
window.onresize = function () {
    myChart_toolAPIBlock.resize();
}
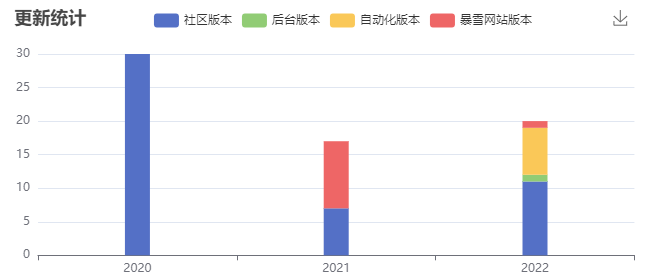
更新统计
-
let myChart_updateBlock = echarts.init(document.getElementById('ta-static-updateBlock'));

myChart_updateBlock.setOption({
    title: {
        top: '4%',
        left: '2%',
        text: '更新统计'
    },
    tooltip: {
        trigger: 'axis',
        axisPointer: {
            type: 'shadow'
        }
    },
    toolbox: {
        show: true,
        top: '3%',
        right: '4%',
        feature: {
            saveAsImage: {
                title: '保存',
            }
        },
        iconStyle: {
            emphasis: {
                borderColor: '#393939',
            },
        },
    },
    legend: {
        left: '23%',
        top:'5%'
    },
    grid: {
        left: '3%',
        right: '4%',
        bottom: '3%',
        containLabel: true
    },
    xAxis: [{
        type: 'category',
        data: ['2020', '2021', '2022']
    }],
    yAxis: [{
        type: 'value'
    }],
    series: [{
        name: '社区版本',
        type: 'bar',
        stack: 'Ad',
        emphasis: {
            focus: 'series'
        },
        data: [30, 7, 10]
    }, {
        name: '后台版本',
        type: 'bar',
        stack: 'Ad',
        emphasis: {
            focus: 'series'
        },
        data: [0, 0, 1]
    }, {
        name: '自动化版本',
        type: 'bar',
        stack: 'Ad',
        emphasis: {
            focus: 'series'
        },
        data: [0, 0, 6]
    }, {
        name: '暴雪网站版本',
        type: 'bar',
        barWidth: 25,
        stack: 'Ad',
        emphasis: {
            focus: 'series'
        },
        data: [0, 10, 1]
    }]
})

window.onresize = function () {
    myChart_updateBlock.resize();
}
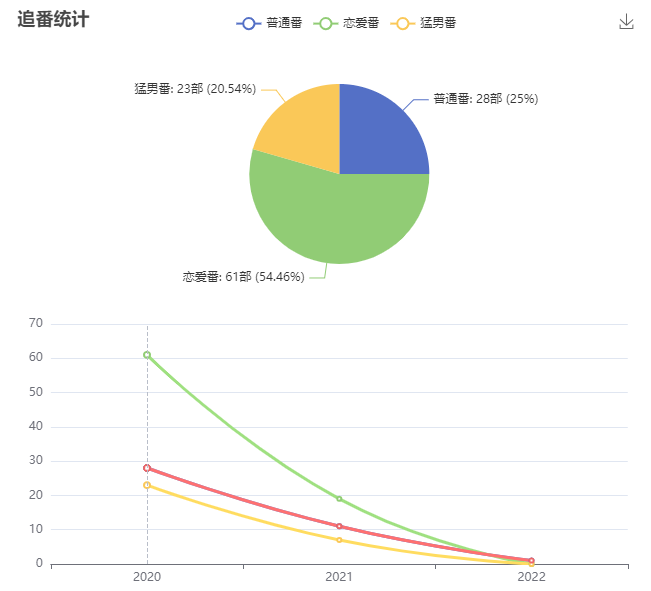
追番统计
-
let myChart_animeBlock = echarts.init(document.getElementById('ta-static-animeBlock')); myChart_animeBlock.setOption(option = { title: { top: '2%', left: '1%', text: '追番统计' }, legend: { top: '3%', left: '35%' }, tooltip: { trigger: 'axis', showContent: false }, toolbox: { show: true, top: '2%', right: '1%', feature: { saveAsImage: { title: '保存' } }, iconStyle: { emphasis: { borderColor: '#393939', }, }, }, dataset: { source: [ ['年份', '2020', '2021', '2022'], ['普通番', 28, 11, 1], ['恋爱番', 61, 19, 0], ['猛男番', 23, 7, 0] ] }, xAxis: { type: 'category' }, yAxis: { gridIndex: 0 }, grid: { top: '55%', left:'7%', right: '3%', bottom: '5%' }, series: [{ type: 'line', smooth: true, seriesLayoutBy: 'row', emphasis: { focus: 'series' } }, { type: 'line', smooth: true, seriesLayoutBy: 'row', emphasis: { focus: 'series' } }, { type: 'line', smooth: true, seriesLayoutBy: 'row', emphasis: { focus: 'series' } }, { type: 'pie', id: 'pie', radius: '30%', center: ['52%', '30%'], emphasis: { focus: 'self' }, label: { formatter: '{b}: {@2020}部 ({d}%)' }, encode: { itemName: '年份', value: '2020', tooltip: '2020' } }] }); - • 这个图表还有方法:可以hover下面的统计图,上面的饼图会改变
-
myChart_animeBlock.on('updateAxisPointer', function (event) {
    const xAxisInfo = event.axesInfo[0];
    if (xAxisInfo) {
        const dimension = xAxisInfo.value + 1;
        myChart_animeBlock.setOption({
            series: {
                id: 'pie',
                label: {
                    formatter: '{b}: {@[' + dimension + ']}部 ({d}%)'
                },
                encode: {
                    value: dimension,
                    tooltip: dimension
                }
            }
        });
    }
});

window.onresize = function () {
    myChart_animeBlock.resize();
}